Monitoring Veeam Backup & Replication with vROps

Backup servers, I think we can all agree, are of primary importance. We rely upon them for business continuity as much as we rely upon other systems of primary record like Active Directory or DNS. So why is it that we monitor the latter systems with such fervor and the former not at all? Often times, we don’t know that backup systems are impacted until we go to attempt a restore when it’s necessary only to find it doesn’t work or you don’t have the needed restore point. We need to bring the same type of monitoring visibility to data protection systems that we bring to others. In order to do so, let’s look at monitoring Veeam Backup & Replication with vRealize Operations Manager. In this article, I’m going to illustrate how you can do so with Veeam Backup & Replication 9.5 Update 2 and vROps 6.6.1. The basic idea is to use the Endpoint Operations (EpOps) agent, which I’ll install on the Veeam server, and report back to vROps with the status on the various Veeam services.
We obviously need a working vROps system, but in addition we need to download the EpOps agent for Windows from MyVMware (my.vmware.com). Once you’ve grabbed the Windows EXE package that contains Java, download it to the Veeam B&R server. Before you start the installer, however, let’s get a plugin for vROps that can monitor the SQL database portion of Veeam as an added bonus. Navigate to this page on the Solution Exchange and download the plugin. Install into vROps under Administration -> Solutions. There are many guides that illustrate how to install a management pack, and the same process can be used here for an EpOps plug-in so I won’t cover it. Go back to your Veeam server and begin the installation wizard and input the values it requests. The second step in the wizard asks for the certificate thumbprint.
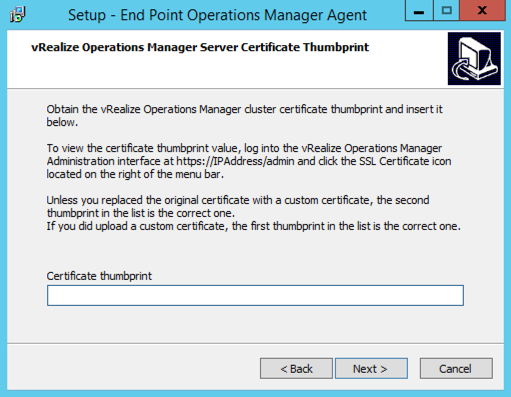
This you’ll have to get by logging into the administrative interface of vROps at https://<FQDN>/admin and selecting the
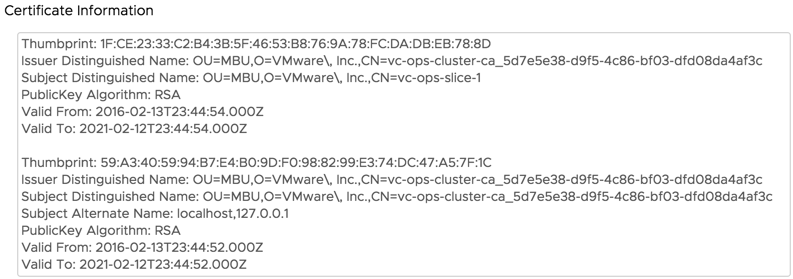
In my case, this is a lab so I’m just using a self-signed certificate. Copy the thumbprint and paste it into the installer. Complete the installation by providing vROps credentials that have EpOps agent permissions. After installation, login to vROps and go to Administration -> Configuration -> End Point Operations and ensure your system is showing up and you have green icons. Beware it may take five minutes or so for everything to turn green.

Once all is green, the Veeam server is now reporting directly to vROps through use of this nifty agent. Now, browse to Environment -> Operating Systems -> Windows and expand the list. You should now see your Veeam server there and it will look something like this.

The first object in the tree with the “OS” in the monitor is the entry for the operating system entity, followed by the EpOps agent, and finally the SQL Express instance (or SQL Standard if you opted to use a full-blown SQL server). Clicking on any of these objects will give you the basic Summary dashboard, and under All Metrics you can see distinct metrics that each is reporting.
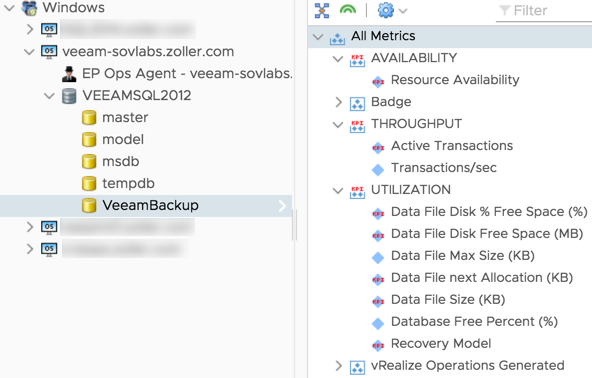
We can also see the databases on the system courtesy of the EpOps SQL plug-in we installed earlier, as well as metrics specific to each database. Notice how we did nothing to accomplish this? The SQL instance and databases are discovered by the plug-in. Very handy! And by the way, if you want even deeper visibility into how Veeam is using its SQL database, I’d recommend looking at the Blue Medora management pack for SQL as it contains a wealth of metrics that really allow you to dig deep into the application.
Next, we need to add in the various Veeam services we want to monitor. If you’ve installed Veeam in a single-system setup, you’ll want to monitor everything there (most likely) including things like the Data Mover and Mount services.

In order to pick and choose the ones you want, we need to add them to vROps. Start by double-clicking a service in the list and note its service name (not the display name). Of primary importance is probably the Veeam Backup Service, so let’s start there.
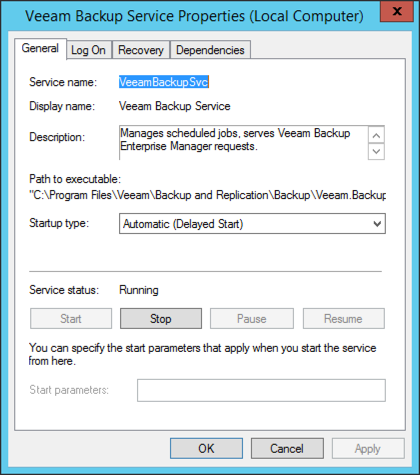
The name is “VeeamBackupSvc” and this is what we must copy. From within vROps, click the Actions menu when you’re on the OS entity object and go to Monitor OS Object -> Monitor Windows Service.

Fill out the simple window and include a display name as you see fit. I just used the service display name for consistency.
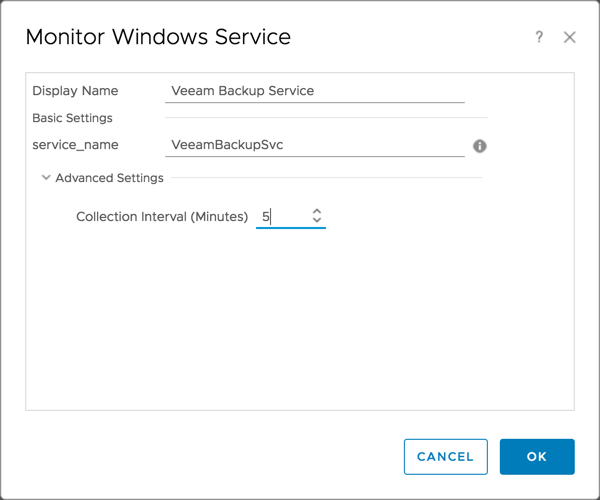
I’d recommend setting the collection interval to 5, which is the default interval at which vROps collects metrics from external systems anyhow. Once done, you should now have a new object in the tree that represents the Veeam Backup service. Give it a couple collection cycles and ensure the object is collecting and shows online. Check out the metrics that are reported, specifically AVAILABILITY/Resource Availability (indicates if the service is up or down) and those under UTILIZATION (indicating CPU usage and in-memory size). Now to test that the monitoring of the backup service is working, stop the Windows service (obviously don’t do this during a backup job). Check the Alerts section in vROps and we should see something after a few minutes.

This generic alert indicates the object, whatever that is, has an availability score of zero or is down. Now with this alert, you can forward it across to your email systems, ticketing systems, or anything else that you may choose. In addition, you can build your own custom alert and symptom definition if you would like. The only thing left at this point is to add the remainder of the Veeam services and configure custom alerts and notification plug-ins. Now you should have a good understanding of the health of your Veeam server through EpOps agents and vROps.